Marketplace Operations & Revenue Analytics (Olist)
End-to-end analytics on a Brazilian e-commerce marketplace: I loaded ~100k orders into a cloud warehouse, modeled and tested them with dbt, ran the analysis in SQL, designed a controlled experiment, and shipped a live interactive dashboard.
- Built a BigQuery + dbt pipeline: 9 raw tables modeled into a tested star schema (staging → facts) with automated data-quality tests.
- Wrote analytical SQL (window functions, CTEs) for revenue trends, delivery performance, seller concentration, and customer retention.
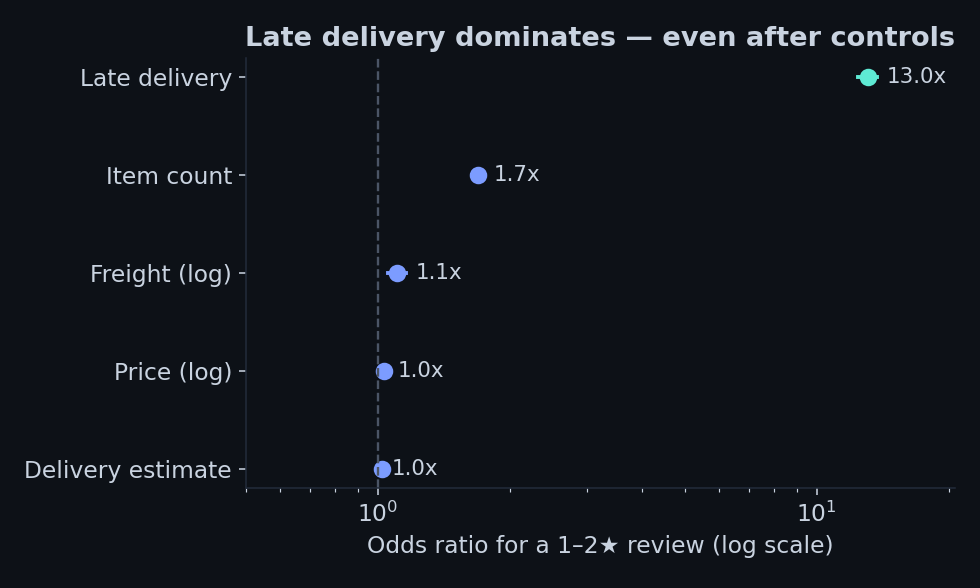
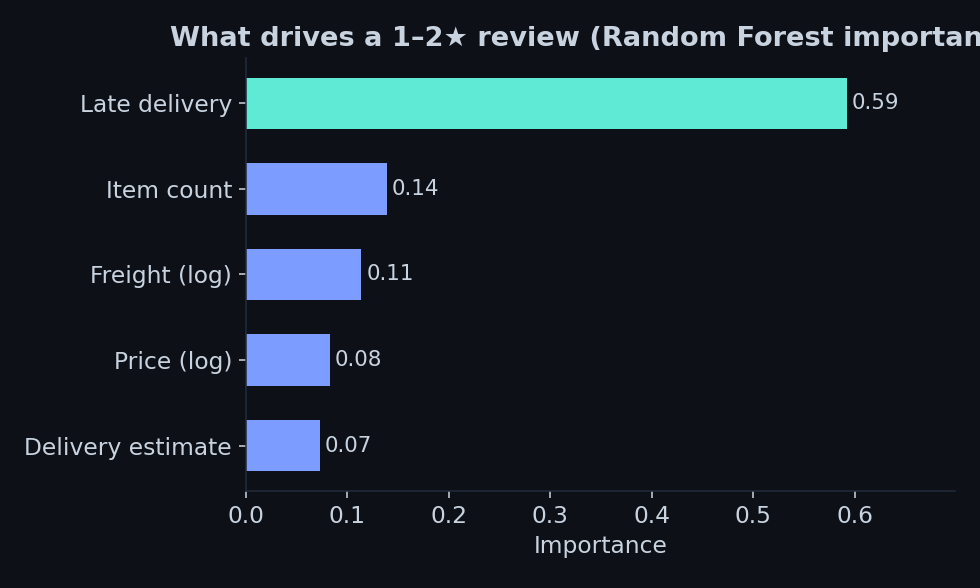
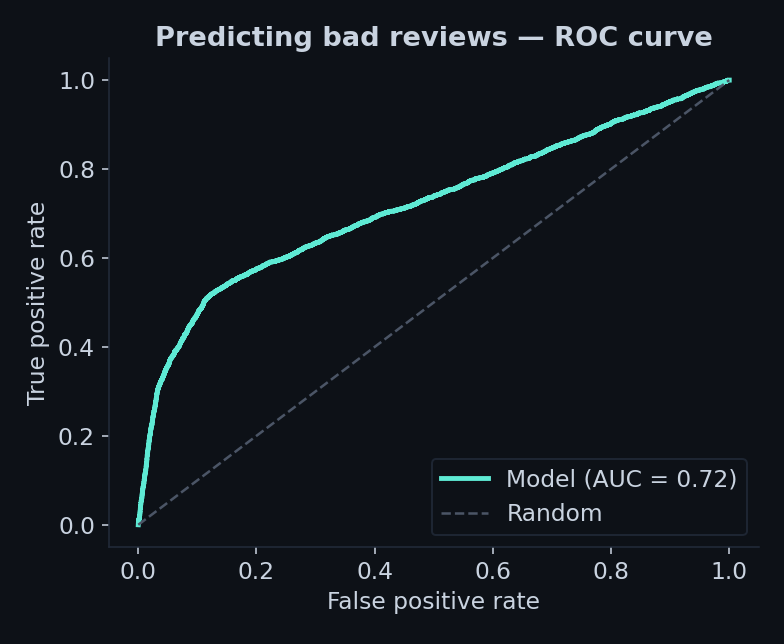
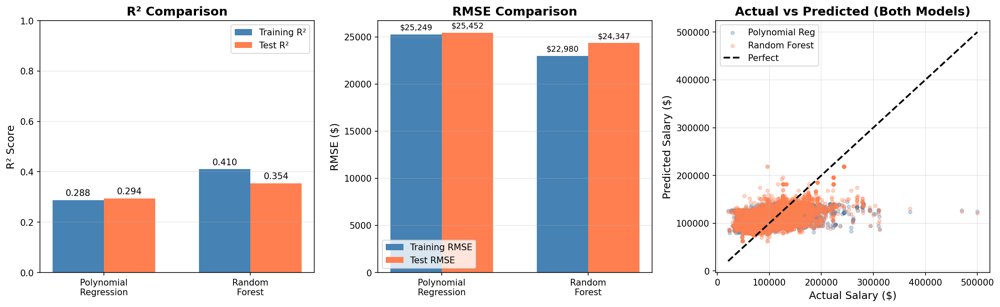
- Confirmed the effect is causal, not just correlation: a logistic regression controlling for price, freight, item count, and delivery estimate still put late orders at ~13x the odds of a bad review, and a Random Forest ranked late delivery the top driver (notebook).
- Designed an A/B test (hypothesis, primary + guardrail metrics, sample size) to validate a more conservative delivery promise.
- Shipped an interactive Tableau dashboard from the modeled data, embedded live below.
Late deliveries are only ~8% of orders but do outsized damage: they average a 2.57 review score versus 4.29 on time, and are roughly 6x more likely to draw a 1–2★ rating. Since 96.9% of customers never buy again, that first delivery is effectively the whole relationship. Revenue is also concentrated, the top 20% of sellers drive 82% of it, so the recommended lever is a more conservative delivery promise, tested via a clean experiment.
Under-promise delivery dates (add a buffer at checkout) to cut late-vs-promise orders, the biggest controllable lever, validated with an A/B test. Send proactive delay alerts to soften the hit when an order will run late. Protect the top 20% of sellers who drive 82% of revenue with reliable fulfillment. And add a post-first-order retention nudge, since ~97% of customers never come back.